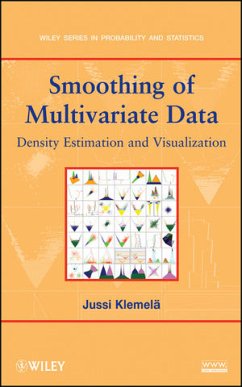
An applied treatment of the key methods and state-of-the-art tools for visualizing and understanding statistical data Smoothing of Multivariate Data provides an illustrative and hands-on approach to the multivariate aspects of density estimation, emphasizing the use of visualization tools. Rather than outlining the theoretical concepts of classification and regression, this book focuses on the procedures for estimating a multivariate distribution via smoothing. The author first provides an introduction to various visualization tools that can be used to construct representations of multivariate functions, sets, data, and scales of multivariate density estimates. Next, readers are presented with an extensive review of the basic mathematical tools that are needed to asymptotically analyze the behavior of multivariate density estimators, with coverage of density classes, lower bounds, empirical processes, and manipulation of density estimates. The book concludes with an extensive toolbox of multivariate density estimators, including anisotropic kernel estimators, minimization estimators, multivariate adaptive histograms, and wavelet estimators. A completely interactive experience is encouraged, as all examples and figurescan be easily replicated using the R software package, and every chapter concludes with numerous exercises that allow readers to test their understanding of the presented techniques. The R software is freely available on the book's related Web site along with "Code" sections for each chapter that provide short instructions for working in the R environment. Combining mathematical analysis with practical implementations, Smoothing of Multivariate Data is an excellent book for courses in multivariate analysis, data analysis, and nonparametric statistics at the upper-undergraduate and graduatelevels. It also serves as a valuable reference for practitioners and researchers in the fields of statistics, computer science, economics, and engineering.


