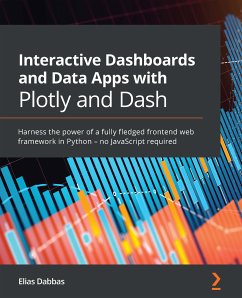
Plotly's Dash framework is a life-saver for Python developers who want to develop complete data apps and interactive dashboards without JavaScript, but you'll need to have the right guide to make sure you're getting the most of it. With the help of this book, you'll be able to explore the functionalities of Dash for visualizing data in different ways.
Interactive Dashboards and Data Apps with Plotly and Dash will first give you an overview of the Dash ecosystem, its main packages, and the third-party packages crucial for structuring and building different parts of your apps. You'll learn how to create a basic Dash app and add different features to it.
Next, you'll integrate controls such as dropdowns, checkboxes, sliders, date pickers, and more in the app and then link them to charts and other outputs. Depending on the data you are visualizing, you'll also add several types of charts, including scatter plots, line plots, bar charts, histograms, and maps, as well as explore the options available for customizing them.
By the end of this book, you'll have developed the skills you need to create and deploy an interactive dashboard, handle complexities and code refactoring, and understand the process of improving your application.
Dieser Download kann aus rechtlichen Gründen nur mit Rechnungsadresse in A, B, BG, CY, CZ, D, DK, EW, E, FIN, F, GR, H, IRL, I, LT, L, LR, M, NL, PL, P, R, S, SLO, SK ausgeliefert werden.


