Schade – dieser Artikel ist leider ausverkauft. Sobald wir wissen, ob und wann der Artikel wieder verfügbar ist, informieren wir Sie an dieser Stelle.
  • Format: ePub

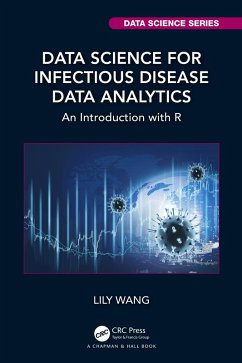
With a quick start guide to epidemiological data visualization and analysis in R, this book spans the gulf between academia and practices providing many lively, instructive data analysis examples using the most up-to-date data, such as the newly discovered COVID-19.

  • Geräte: eReader
  • ohne Kopierschutz
  • eBook Hilfe
  • Größe: 30.37MB
Produktbeschreibung
With a quick start guide to epidemiological data visualization and analysis in R, this book spans the gulf between academia and practices providing many lively, instructive data analysis examples using the most up-to-date data, such as the newly discovered COVID-19.


Dieser Download kann aus rechtlichen Gründen nur mit Rechnungsadresse in A, B, BG, CY, CZ, D, DK, EW, E, FIN, F, GR, HR, H, IRL, I, LT, L, LR, M, NL, PL, P, R, S, SLO, SK ausgeliefert werden.

Autorenporträt
Dr. Lily Wang is a tenured professor of statistics at George Mason University. She earned her PhD in statistics from Michigan State University in 2007. Before joining Mason in 2021, she was on the faculty of Iowa State University (2014-2021) and the University of Georgia (2007-2014). Her primary research areas include non/semi-parametric modeling and inference, statistical learning of data objects with complex features, methodologies for functional data, spatiotemporal data, imaging, and general issues related to data science and big data analytics. Dr. Wang is a fellow of both the Institute of Mathematical Statistics and the American Statistical Association and an Elected Member of the International Statistical Institute. She is currently serving on the editorial board of Journal of the Royal Statistical Society, Series B, Journal of Nonparametric Statistics and Statistical Analysis and Data Mining.