A fresh take on financial data visualization for greater accuracy and understanding
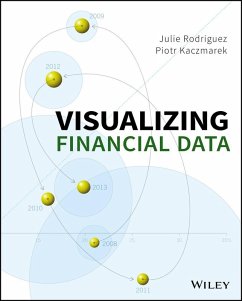
Visualizing Financial Data shows you how to design dynamic, best-of-breed visualizations for better communication of financial data. This book provides a comprehensive set of visualizations tailored to the most common requirements for corporate financial reporting, as well as portfolio, mutual fund, and hedge fund management. This highly visual, full color book showcases a series of cases that push data communication conventions forward, demonstrating and contrasting traditional bar, line, and pie charts against more modern visual methods. The companion website features all of the visualizations discussed, and provides the underlying datasets that you can use to practice on your own or customize the visualizations for your own use.
Get a fresh take on visualizations and insight you need to communicate financial data better than ever before.
Expand the boundaries of data visualization conventions
Optimize data communications, understanding, and disclosure
Learn new approaches to traditional charts and visualizations
Create exemplary visualizations
Visualizing Financial Data shows you newer, better ways of communicating the full meaning of the data, to support efficient, timely, and effective decision-making.

