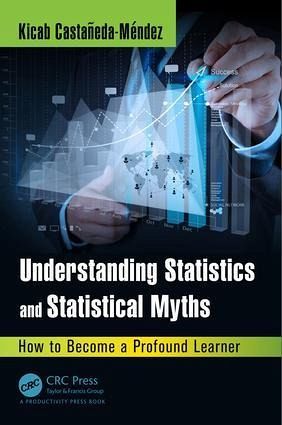
Kicab Castaneda-Mendez
Understanding Statistics and Statistical Myths
How to Become a Profound Learner
Kicab Castaneda-Mendez
Understanding Statistics and Statistical Myths
How to Become a Profound Learner
- Gebundenes Buch
- Merkliste
- Auf die Merkliste
- Bewerten Bewerten
- Teilen
- Produkt teilen
- Produkterinnerung
- Produkterinnerung
Addressing 30 statistical myths, this book explains how to understand statistics rather than how to do statistics. In the book, six characters discuss various topics-including data, estimation, measurement system analysis, capability, hypothesis testing, statistical inference, and control charts-taught in a fictional course that teaches students how to apply statistics to improve processes. Readers follow along and learn as the students apply what they learn to a project in which they are team members.
Andere Kunden interessierten sich auch für
- Yasuhiro Monden (Mejiro University)Toyota Production System95,99 €
- Chris A. OrtizThe 5s Playbook49,99 €
- Rajan Suri (Center for Quick Response Manufactur Founding DirectorQuick Response Manufacturing86,99 €
- Chris A. OrtizThe Cell Manufacturing Playbook55,99 €
- DR. JOHN NICHOLASLean Production for Competitive Advantage101,99 €
- Alin PosteucaManufacturing Cost Policy Deployment (McPd) and Methods Design Concept (MDC)85,99 €
- Peihua QiuIntroduction to Statistical Process Control144,99 €
-
-
-
Addressing 30 statistical myths, this book explains how to understand statistics rather than how to do statistics. In the book, six characters discuss various topics-including data, estimation, measurement system analysis, capability, hypothesis testing, statistical inference, and control charts-taught in a fictional course that teaches students how to apply statistics to improve processes. Readers follow along and learn as the students apply what they learn to a project in which they are team members.
Produktdetails
- Produktdetails
- Verlag: Taylor & Francis Inc
- Seitenzahl: 537
- Erscheinungstermin: 18. November 2015
- Englisch
- Abmessung: 234mm x 156mm x 32mm
- Gewicht: 1030g
- ISBN-13: 9781498727457
- ISBN-10: 149872745X
- Artikelnr.: 43020653
- Herstellerkennzeichnung
- Libri GmbH
- Europaallee 1
- 36244 Bad Hersfeld
- gpsr@libri.de
Kicab Castaneda-Mendez, founder of Process Excellence Consultants, Chapel Hill, NC, provides consulting and training on operational excellence using lean Six Sigma methodologies, balanced scorecard and Baldrige framework.
Myth 1: Two Types of Data-Attribute/Discrete and Measurement/Continuous. Myth 2: Proportions and Percentages Are Discrete Data. Myth 3: s =
[
(Xi- x)2/(n- 1)] The Correct Formula for Sample Standard Deviation. Myth 4: Sample Standard Deviation
[
(Xi-x)2/(n- 1)] Is Unbiased. Myth 5: Variances Can Be Added but Not Standard Deviations. Myth 6: Parts and Operators for an MSA Do Not Have to Be Randomly Selected. Myth 7: % Study (% Contribution, Number of Distinct Categories) Is the Best Criterion for Evaluating a Measurement System for Process Improvement. Myth 8: Only Sigma Can Compare Different Processes and Metrics. Myth 9: Capability Is Not Percent/Proportion of Good Units. Myth 10: p = Probability of Making an Error. Myth 11: Need More Data for Discrete Data than Continuous Data Analysis. Myth 12: Nonparametric Tests Are Less Powerful than Parametric Tests. Myth 13: Sample Size of 30 Is Acceptable (for Statistical Significance). Myth 14: Can Only Fail to Reject Ho, Can Never Accept Ho. Myth 15: Control Limits Are ±3 Standard Deviations from the Center Line. Myth 16: Control Chart Limits Are Empirical Limits. Myth 17: Control Chart Limits Are Not Probability Limits. Myth 18: ±3 Sigma Limits Are the Most Economical Control Chart Limits. Myth 19: Statistical Inferences Are Inductive Inferences. Myth 20: There Is One Universe or Population If Data Are Homogeneous. Myth 21: Control Charts Are Analytic Studies. Myth 22: Control Charts Are Not Tests of Hypotheses. Myth 23: Process Needs to Be Stable to Calculate Process Capability. Myth 24: Specifications Don't Belong on Control Charts. Myth 25: Identify and Eliminate Assignable or Assignable Causes of Variation. Myth 26: Process Needs to Be Stable before You Can Improve It. Myth 27: Stability (Homogeneity) Is Required to Establish a Baseline? Myth 28: A Process Must Be Stable to Be Predictable. Myth 29: Adjusting a Process Based on a Single Defect Is Tampering, Causing Increased Process Variation. Myth 30: No Assumptions Required When the Data Speak for Themselves.
[
(Xi- x)2/(n- 1)] The Correct Formula for Sample Standard Deviation. Myth 4: Sample Standard Deviation
[
(Xi-x)2/(n- 1)] Is Unbiased. Myth 5: Variances Can Be Added but Not Standard Deviations. Myth 6: Parts and Operators for an MSA Do Not Have to Be Randomly Selected. Myth 7: % Study (% Contribution, Number of Distinct Categories) Is the Best Criterion for Evaluating a Measurement System for Process Improvement. Myth 8: Only Sigma Can Compare Different Processes and Metrics. Myth 9: Capability Is Not Percent/Proportion of Good Units. Myth 10: p = Probability of Making an Error. Myth 11: Need More Data for Discrete Data than Continuous Data Analysis. Myth 12: Nonparametric Tests Are Less Powerful than Parametric Tests. Myth 13: Sample Size of 30 Is Acceptable (for Statistical Significance). Myth 14: Can Only Fail to Reject Ho, Can Never Accept Ho. Myth 15: Control Limits Are ±3 Standard Deviations from the Center Line. Myth 16: Control Chart Limits Are Empirical Limits. Myth 17: Control Chart Limits Are Not Probability Limits. Myth 18: ±3 Sigma Limits Are the Most Economical Control Chart Limits. Myth 19: Statistical Inferences Are Inductive Inferences. Myth 20: There Is One Universe or Population If Data Are Homogeneous. Myth 21: Control Charts Are Analytic Studies. Myth 22: Control Charts Are Not Tests of Hypotheses. Myth 23: Process Needs to Be Stable to Calculate Process Capability. Myth 24: Specifications Don't Belong on Control Charts. Myth 25: Identify and Eliminate Assignable or Assignable Causes of Variation. Myth 26: Process Needs to Be Stable before You Can Improve It. Myth 27: Stability (Homogeneity) Is Required to Establish a Baseline? Myth 28: A Process Must Be Stable to Be Predictable. Myth 29: Adjusting a Process Based on a Single Defect Is Tampering, Causing Increased Process Variation. Myth 30: No Assumptions Required When the Data Speak for Themselves.