23,99 €
inkl. MwSt.

Versandfertig in 6-10 Tagen
payback
12 °P sammeln
  • Broschiertes Buch

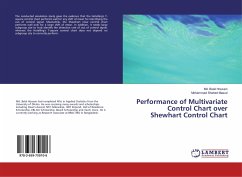
The conducted simulation study gives the evidence that the Hotelling's T-square control chart performs well for any shift of mean for identifying the out of control signal. Meanwhile, the Shewhart x-bar control chart performs well only for a large shift of mean. In addition, it needs large subgroup size to truly identify the detection rate of out of control signal, whereas the Hotelling's T-square control chart does not depend on subgroup size to correctly perform.

Produktbeschreibung
The conducted simulation study gives the evidence that the Hotelling's T-square control chart performs well for any shift of mean for identifying the out of control signal. Meanwhile, the Shewhart x-bar control chart performs well only for a large shift of mean. In addition, it needs large subgroup size to truly identify the detection rate of out of control signal, whereas the Hotelling's T-square control chart does not depend on subgroup size to correctly perform.
Autorenporträt
Md. Belal Hossain had completed MSc in Applied Statistics from the University of Dhaka. He was receiving many awards and scholarships including Dean's Award, NST Fellowship, ISRT Stipend, Hall of Residence Scholarship, EBL-DU Scholarship, Board Scholarship and much more. He is currently working as Research Associate at BRAC RED in Bangladesh.