54,99 €
inkl. MwSt.
Versandkostenfrei*
Versandfertig in über 4 Wochen
payback
27 °P sammeln
  • Broschiertes Buch

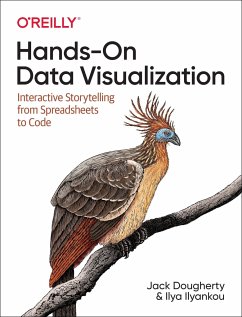
Tell your story and show it with data, using free and easy-to-learn tools on the web. This introductory book teaches you how to design interactive charts and customized maps for your website, beginning with simple drag-and-drop tools such as Google Sheets, Datawrapper, and Tableau Public.

Produktbeschreibung
Tell your story and show it with data, using free and easy-to-learn tools on the web. This introductory book teaches you how to design interactive charts and customized maps for your website, beginning with simple drag-and-drop tools such as Google Sheets, Datawrapper, and Tableau Public.
Autorenporträt
Jack Dougherty is a Professor of Educational Studies at Trinity College in Hartford, Connecticut. Professor Dougherty has taught data visualization to undergraduates at Trinity College and to thousands of participants in a global online course. He and his students have partnered with dozens of non-profit organizations, journalists, and researchers to help tell their data stories on the web. Ilya Ilyankou is an Independent Technologist. Ilya has been working with CTData Collaborative to build data visualization and data exploration tools for Connecticut for two years. He studied Computer Science and Studio Arts at Trinity College, Hartford.