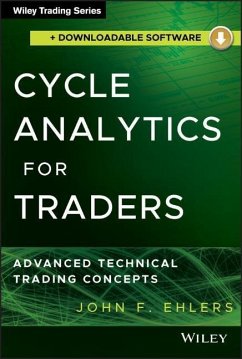
A technical resource for self-directed traders who want to understand the scientific underpinnings of the filters and indicators used in trading decisions
This is a technical resource book written for self-directed traders who want to understand the scientific underpinnings of the filters and indicators they use in their trading decisions. There is plenty of theory and years of research behind the unique solutions provided in this book, but the emphasis is on simplicity rather than mathematical purity. In particular, the solutions use a pragmatic approach to attain effective trading results. Cycle Analytics for Traders will allow traders to think of their indicators and trading strategies in the frequency domain as well as their motions in the time domain. This new viewpoint will enable them to select the most efficient filter lengths for the job at hand.
Shows an awareness of Spectral Dilation, and how to eliminate it or to use it to your advantage
Discusses how to use Automatic Gain Control (AGC) to normalize indicator amplitude swings
Explains thinking of prices in the frequency domain as well as in the time domain
Creates an awareness that all indicators are statistical rather than absolute, as implied by their single line displays
Sheds light on several advanced cookbook filters
Showcases new advanced indicators like the Even Better Sinewave and Decycler Indicators
Explains how to use transforms to improve the display and interpretation of indicators

