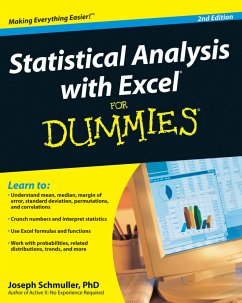
You too can understand the statistics of life, even if you'remath-challenged! What do you need to calculate? Manufacturing output? A curve fortest scores? Sports stats? You and Excel can do it, and thisnon-intimidating guide shows you how. It demystifies the differenttypes of statistics, how Excel functions and formulas work, themeaning of means and medians, how to interpret your figures, andmore -- in plain English. * Getting there -- learn how variables, samples, andprobability are used to get the information you want * Excel tricks -- find out what's built into the program tohelp you work with Excel formulas * Playing with worksheets -- get acquainted with the worksheetfunctions for each step * Graphic displays -- present your data as pie graphs, bargraphs, line graphs, or scatter plots * What's normal? -- understand normal distribution andprobability * Hyping hypotheses -- learn to use hypothesis testing withmeans and variables * When regression is progress -- discover when and how to useregression for forecasting * What are the odds -- work with probability, randomvariables, and binomial distribution Open the book and find: * Ten statistical and graphical tips and traps * The difference between descriptive and inferentialstatistics * Why graphs are good * How to measure variations * What standard scores are and why they're used * When to use two-sample hypothesis testing * How to use correlations * Different ways of working with probability

