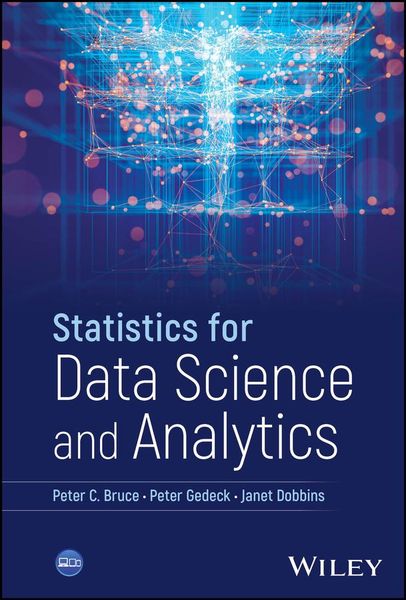
Statistics for Data Science and Analytics
136,99 €
inkl. gesetzl. MwSt.,
Lieferung nach Hause
Beschreibung
Produktdetails
Einband
Gebundene Ausgabe
Erscheinungsdatum
04.09.2024
Verlag
WileySeitenzahl
384
Maße (L/B/H)
23,1/15,6/2,6 cm
Gewicht
652 g
Sprache
Englisch
ISBN
978-1-394-25380-7
Introductory statistics textbook with a focus on data science topics such as prediction, correlation, and data exploration
Statistics for Data Science and Analytics is a comprehensive guide to statistical analysis using Python, presenting important topics useful for data science such as prediction, correlation, and data exploration. The authors provide an introduction to statistical science and big data, as well as an overview of Python data structures and operations.
A range of statistical techniques are presented with their implementation in Python, including hypothesis testing, probability, exploratory data analysis, categorical variables, surveys and sampling, A/B testing, and correlation. The text introduces binary classification, a foundational element of machine learning, validation of statistical models by applying them to holdout data, and probability and inference via the easy-to-understand method of resampling and the bootstrap instead of using a myriad of "kitchen sink" formulas. Regression is taught both as a tool for explanation and for prediction.
This book is informed by the authors' experience designing and teaching both introductory statistics and machine learning at Statistics.com. Each chapter includes practical examples, explanations of the underlying concepts, and Python code snippets to help readers apply the techniques themselves.
Statistics for Data Science and Analytics includes information on sample topics such as:
- Int, float, and string data types, numerical operations, manipulating strings, converting data types, and advanced data structures like lists, dictionaries, and sets
- Experiment design via randomizing, blinding, and before-after pairing, as well as proportions and percents when handling binary data
- Specialized Python packages like numpy, scipy, pandas, scikit-learn and statsmodels--the workhorses of data science--and how to get the most value from them
- Statistical versus practical significance, random number generators, functions for code reuse, and binomial and normal probability distributions
Written by and for data science instructors, Statistics for Data Science and Analytics is an excellent learning resource for data science instructors prescribing a required intro stats course for their programs, as well as other students and professionals seeking to transition to the data science field.
Noch keine Bewertungen vorhanden
Verfassen Sie die erste Bewertung zu diesem Artikel
Helfen Sie anderen Kundinnen und Kunden durch Ihre Meinung.
Kurze Frage zu unserer Seite
Vielen Dank für dein Feedback
Wir nutzen dein Feedback, um unsere Produktseiten zu verbessern. Bitte habe Verständnis, dass wir dir keine Rückmeldung geben können. Falls du Kontakt mit uns aufnehmen möchtest, kannst du dich aber gerne an unseren Kund*innenservice wenden.
zum Kundenservice