KI-Beratung Beta

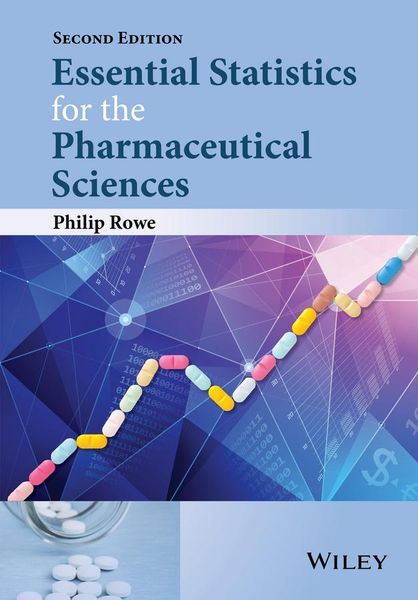
Produktbild: Essential Statistics for the Pharmaceutical Sciences

Essential Statistics for the Pharmaceutical Sciences

134,99 €

inkl. gesetzl. MwSt., Versandkostenfrei


Beschreibung

Produktdetails

Einband

Gebundene Ausgabe

Erscheinungsdatum

28.09.2015

Verlag

John Wiley & Sons Inc

Seitenzahl

440

Maße (L/B/H)

24,5/17,2/2,5 cm

Gewicht

790 g

Auflage

2nd Revised edition

Sprache

Englisch

ISBN

978-1-118-91338-3

Beschreibung

Produktdetails

Einband

Gebundene Ausgabe

Erscheinungsdatum

28.09.2015

Verlag

John Wiley & Sons Inc

Seitenzahl

440

Maße (L/B/H)

24,5/17,2/2,5 cm

Gewicht

790 g

Auflage

2nd Revised edition

Sprache

Englisch

ISBN

978-1-118-91338-3

Herstelleradresse

Libri GmbH
Europaallee 1
36244 Bad Hersfeld
DE

Email: gpsr@libri.de

Noch keine Bewertungen vorhanden

Verfassen Sie die erste Bewertung zu diesem Artikel

Helfen Sie anderen Kundinnen und Kunden durch Ihre Meinung.

Kundinnen und Kunden meinen

Bewertungen (0)

Die Leseprobe wird geladen.
  • Produktbild: Essential Statistics for the Pharmaceutical Sciences
  • Preface xiii
     
    Statistical packages xix
     
    About the website xxi
     
    PART 1 PRESENTING DATA 1
     
    1 Data types 3
     
    1.1 Does it really matter? 3
     
    1.2 Interval scale data 4
     
    1.3 Ordinal scale data 4
     
    1.4 Nominal scale data 5
     
    1.5 Structure of this book 6
     
    1.6 Chapter summary 6
     
    2 Data presentation 7
     
    2.1 Numerical tables 8
     
    2.2 Bar charts and histograms 9
     
    2.3 Pie charts 14
     
    2.4 Scatter plots 16
     
    2.5 Pictorial symbols 21
     
    2.6 Chapter summary 22
     
    PART 2 INTERVAL?]SCALE DATA 23
     
    3 Descriptive statistics for interval scale data 25
     
    3.1 Summarising data sets 25
     
    3.2 Indicators of central tendency: Mean, median and mode 26
     
    3.3 Describing variability - standard deviation and coefficient of variation 33
     
    3.4 Quartiles - Another way to describe data 36
     
    3.5 Describing ordinal data 40
     
    3.6 Using computer packages to generate descriptive statistics 43
     
    3.7 Chapter summary 45
     
    4 The normal distribution 47
     
    4.1 What is a normal distribution? 47
     
    4.2 Identifying data that are not normally distributed 48
     
    4.3 Proportions of individuals within 1SD or 2SD of the mean 52
     
    4.4 Skewness and kurtosis 54
     
    4.5 Chapter summary 57
     
    4.6 Appendix: Power, sample size and the problem of attempting to test for a normal distribution 58
     
    5 Sampling from populations: The standard error of the mean 63
     
    5.1 Samples and populations 63
     
    5.2 From sample to population 65
     
    5.3 Types of sampling error 65
     
    5.4 What factors control the extent of random sampling error when estimating a population mean? 68
     
    5.5 Estimating likely sampling error - The SEM 70
     
    5.6 Offsetting sample size against SD 74
     
    5.7 Chapter summary 75
     
    6 95% Confidence interval for the mean and data transformation 77
     
    6.1 What is a confidence interval? 78
     
    6.2 How wide should the interval be? 78
     
    6.3 What do we mean by '95%' confidence? 79
     
    6.4 Calculating the interval width 80
     
    6.5 A long series of samples and 95% C.I.s 81
     
    6.6 How sensitive is the width of the C.I. to changes in the SD, the sample size or the required level of confidence? 82
     
    6.7 Two statements 85
     
    6.8 One?]sided 95% C.I.s 85
     
    6.9 The 95% C.I. for the difference between two treatments 88
     
    6.10 The need for data to follow a normal distribution and data transformation 90
     
    6.11 Chapter summary 94
     
    7 The two?]sample t?]test (1): Introducing hypothesis tests 95
     
    7.1 The two?]sample t?]test - an example of an hypothesis test 96
     
    7.2 Significance 103
     
    7.3 The risk of a false positive finding 104
     
    7.4 What aspects of the data will influence whether or not we obtain a significant outcome? 106
     
    7.5 Requirements for applying a two?]sample t?]test 108
     
    7.6 Performing and reporting the test 109
     
    7.7 Chapter summary 110
     
    8 The two?]sample t?]test (2): The dreaded P value 111
     
    8.1 Measuring how significant a result is 111
     
    8.2 P values 112
     
    8.3 Two ways to define significance? 113
     
    8.4 Obtaining the P value 113
     
    8.5 P values or 95% confidence intervals? 114
     
    8.6 Chapter summary 115
     
    9 The two?]sample t?]test (3): False negatives, power and necessary sample sizes 117
     
    9.1 What else could possibly go wrong? 118
     
    9.2 Power 119
     
    9.3 Calculating necessary sample size 122
     
    9.4 Chapter summary 130
    &nbs