KI-Beratung Beta

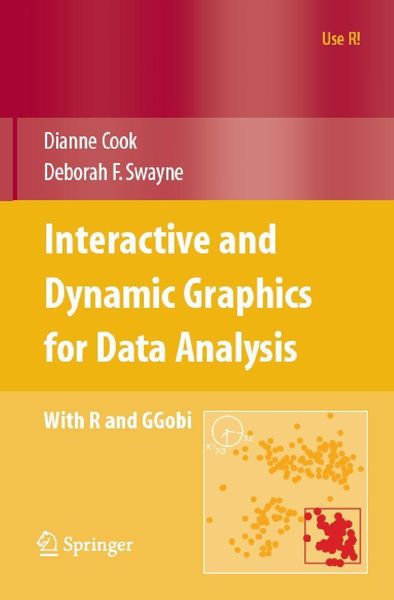
Produktbild: Interactive and Dynamic Graphics for Data Analysis

Interactive and Dynamic Graphics for Data Analysis With R and GGobi

Aus der Reihe Use R!

53,49 €

inkl. gesetzl. MwSt.

Beschreibung

Produktdetails

Format

PDF

Kopierschutz

Nein

Family Sharing

Nein

Text-to-Speech

Nein

Erscheinungsdatum

05.09.2007

Verlag

Springer New York

Seitenzahl

188 (Printausgabe)

Dateigröße

6319 KB

Sprache

Englisch

EAN

9780387717623

Beschreibung

Rezension

From the reviews:

"The central theme of the book is multivariate data visualization. The focus is on interactive and dynamic graphics.… The target audience of the book is (advanced) undergraduate and graduate students, but also industrial statisticians, engineers, bioinformaticists, and computer scientists.… Each chapter ends with some exercises. The chapters are well written and structured, and the examples are well documented.… A reader with a decent knowledge of multivariate statistics … will be happy with this book." (Ruud H. Koning, Kwantitatieve Methoden, 2008R14)

"In this book, R commands are used to exploit the power of the GGobi systems for interactive and dynamic graphics.…This book, … is a very useful brief overview of the insight that a powerful modern suite of graphics tools may offer." (John Maindonald, International Statistical Review, 2008, 76, 3, pages 436-437)

"Diane Cook and Deborah Swayne’s new book, part of Springer’s Use R! series, helps fill an important niche in the literature for the R community and readers of Biometrics. The title of the book indicates the substantial challenge: the book is neither purely methodological nor simply about software. It draws upon the expertise of a wide range of contributors.… I will borrow a phrase the authors use on the opening page: these resources help us "orient ourselves in the sea of information."" (Biometrics 2008)

"The book describes the use of interactive and dynamic graphics as part of multidimensional data analysis. … The book may be used as a text in a class on statistical graphics, exploratory data analysis, visual data mining, or information visualisation. It might also be used as an adjunct text in a course on multivariate data analysis or data mining. Moreover, the book is suitable for an industrial statistician, engineer, bioinformaticist, or computer scientist … . Finally, it may be useful to a mathematician … ." (Christina Diakaki, Zentralblatt MATH, Vol. 1154, 2009)

Produktdetails

Format

PDF

eBooks im PDF-Format haben eine festgelegte Seitengröße und eignen sich daher nur bedingt zum Lesen auf einem tolino eReader oder Smartphone. Für den vollen Lesegenuss empfehlen wir Ihnen bei PDF-eBooks die Verwendung eines Tablets oder Computers.

Kopierschutz

Nein

Dieses eBook können Sie uneingeschränkt auf allen Geräten der tolino Familie, allen sonstigen eReadern und am PC lesen. Das eBook ist nicht kopiergeschützt und kann ein personalisiertes Wasserzeichen enthalten. Weitere Hinweise zum Lesen von eBooks mit einem personalisierten Wasserzeichen finden Sie unter Hilfe/Downloads.

Family Sharing

Nein

Mit Family Sharing können Sie eBooks innerhalb Ihrer Familie (max. sechs Mitglieder im gleichen Haushalt) teilen. Sie entscheiden selbst, welches Buch Sie mit welchem Familienmitglied teilen möchten. Auch das parallele Lesen durch verschiedene Familienmitglieder ist durch Family Sharing möglich. Um eBooks zu teilen oder geteilt zu bekommen, muss jedes Familienmitglied ein Konto bei Thalia oder einem anderen tolino-Buchhändler haben. Weitere Informationen finden Sie unter Hilfe/Family-Sharing.

Text-to-Speech

Nein

Bedeutet Ihnen Stimme mehr als Text? Mit der Funktion Text-to-Speech können Sie sich im tolino webReader und in der aktuellen Thalia – Lesen & Hören App das eBook vorlesen lassen. Weitere Informationen finden Sie unter Hilfe/Text-to-Speech.

Barrierefreiheit

  • keine Information zur Barrierefreiheit bekannt

Erscheinungsdatum

05.09.2007

Verlag

Springer New York

Seitenzahl

188 (Printausgabe)

Dateigröße

6319 KB

Sprache

Englisch

EAN

9780387717623

Noch keine Bewertungen vorhanden

Verfassen Sie die erste Bewertung zu diesem Artikel

Helfen Sie anderen Kundinnen und Kunden durch Ihre Meinung.

Kundinnen und Kunden meinen

Bewertungen (0)

Weitere Artikel findest du in

  • Produktbild: Interactive and Dynamic Graphics for Data Analysis
  • TheToolbox.- Missing Values.- Supervised Classification.- Cluster Analysis.- Miscellaneous Topics.- Datasets.