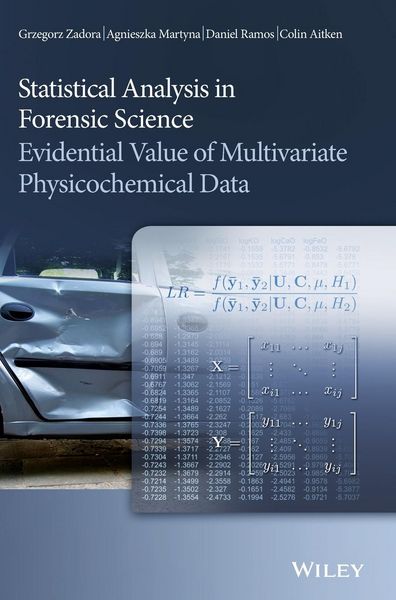
Statistical Analysis in Forensic Science Evidential Value of Multivariate Physicochemical Data
133,99 €
inkl. gesetzl. MwSt.,
Beschreibung
Produktdetails
Einband
Gebundene Ausgabe
Erscheinungsdatum
10.01.2014
Verlag
John Wiley & SonsSeitenzahl
336
Maße (L/B/H)
25/17,5/2,3 cm
Gewicht
766 g
Auflage
1. Auflage
Sprache
Englisch
ISBN
978-0-470-97210-6
Microtraces of various materials (e.g. glass, paint, fibres, and petroleum products) are routinely subjected to physicochemical examination by forensic experts, whose role is to evaluate such physicochemical data in the context of the prosecution and defence propositions. Such examinations return various kinds of information, including quantitative data. From the forensic point of view, the most suitable way to evaluate evidence is the likelihood ratio. This book provides a collection of recent approaches to the determination of likelihood ratios and describes suitable software, with documentation and examples of their use in practice. The statistical computing and graphics software environment R, pre-computed Bayesian networks using Hugin Researcher and a new package, calcuLatoR, for the computation of likelihood ratios are all explored.
Statistical Analysis in Forensic Science will provide an invaluable practical guide for forensic experts and practitioners, forensic statisticians, analytical chemists, and chemometricians.
Key features include:
* Description of the physicochemical analysis of forensic trace evidence.
* Detailed description of likelihood ratio models for determining the evidential value of multivariate physicochemical data.
* Detailed description of methods, such as empirical cross-entropy plots, for assessing the performance of likelihood ratio-based methods for evidence evaluation.
* Routines written using the open-source R software, as well as Hugin Researcher and calcuLatoR.
* Practical examples and recommendations for the use of all these methods in practice.
Noch keine Bewertungen vorhanden
Verfassen Sie die erste Bewertung zu diesem Artikel
Helfen Sie anderen Kundinnen und Kunden durch Ihre Meinung.
Kurze Frage zu unserer Seite
Vielen Dank für dein Feedback
Wir nutzen dein Feedback, um unsere Produktseiten zu verbessern. Bitte habe Verständnis, dass wir dir keine Rückmeldung geben können. Falls du Kontakt mit uns aufnehmen möchtest, kannst du dich aber gerne an unseren Kund*innenservice wenden.
zum Kundenservice