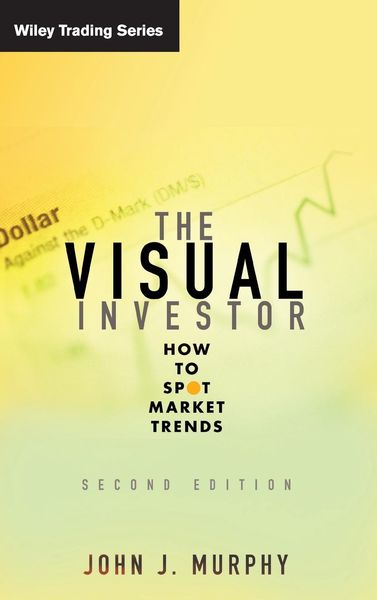

The Visual Investor How to Spot Market Trends
48,99 €
inkl. gesetzl. MwSt.,
Lieferung nach Hause
Beschreibung
Produktdetails
Einband
Gebundene Ausgabe
Erscheinungsdatum
01.02.2009
Verlag
WileySeitenzahl
336
Maße (L/B/H)
23,5/15,7/2,3 cm
Gewicht
522 g
Auflage
2nd edition
Sprache
Englisch
ISBN
978-0-470-38205-9
Visual analysis, also known as technical or chart analysis, is one of the best ways to invest in today's markets--and it's not as hard as you might think. This proven approach allows you to follow almost any market, without having to be an expert on any of them, and it can give you an enormous advantage over those who prefer to use some form of economic or fundamental analysis.
With over forty years of market experience and a number of bestselling financial books to his name, John Murphy, one of the world's foremost technical analysts and educators, knows what it takes to make it in this field. Now, with the Second Edition of The Visual Investor--which has been completely updated for current markets--Murphy shares his invaluable insights on this subject with you.
Written in a straightforward and accessible style, this updated guide will introduce you to "visual" investing by explaining a variety of charting techniques that professionals have used for decades, and shows you how specific visual tools can put you in a better position to successfully trade commodities, currencies, bonds, and stocks in both domestic and global financial markets. With the real-world examples and comprehensive charts found here, you'll quickly discover how to:
- Tell the difference between markets that are trending and those that are not
- Locate important breakouts or breakdowns
- Spot significant support and resistance levels
- Implement asset allocation and sector rotation strategies through exchange-traded funds and mutual funds
- Utilize moving averages to keep track of trends
- Incorporate essential price patterns into your investment analysis
Along the way, Murphy takes you through the ins and outs of reading price and volume charts that can help you make sensible investment decisions, and highlights how you can track the ups and downs of financial markets by visually comparing charts--instead of relying upon complex mathematical formulas and confusing technical concepts.
Knowing why a market is moving is interesting, but not crucial to investment success. In order to trade profitably, all that really matters is what the markets are actually doing. Visual analysis is the best way to determine this, and with the Second Edition of The Visual Investor as your guide, you'll learn how to put this effective approach to work for you to enhance the performance of your portfolio.
Noch keine Bewertungen vorhanden
Verfassen Sie die erste Bewertung zu diesem Artikel
Helfen Sie anderen Kundinnen und Kunden durch Ihre Meinung.
Kurze Frage zu unserer Seite
Vielen Dank für dein Feedback
Wir nutzen dein Feedback, um unsere Produktseiten zu verbessern. Bitte habe Verständnis, dass wir dir keine Rückmeldung geben können. Falls du Kontakt mit uns aufnehmen möchtest, kannst du dich aber gerne an unseren Kund*innenservice wenden.
zum Kundenservice