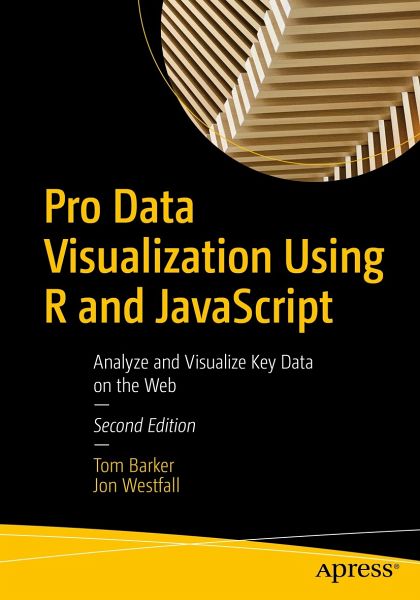
Pro Data Visualization Using R and JavaScript (eBook, PDF)
Analyze and Visualize Key Data on the Web
Versandkostenfrei!
Sofort per Download lieferbar
47,95 €
inkl. MwSt.
Weitere Ausgaben:

PAYBACK Punkte
24 °P sammeln!
Use R 4, RStudio, Tidyverse, and Shiny to interrogate and analyze your data, and then use the D3 JavaScript library to format and display that data in an elegant, informative, and interactive way. You will learn how to gather data effectively, and also how to understand the philosophy and implementation of each type of chart, so as to be able to represent the results visually.With the popularity of the R language, the art and practice of creating data visualizations is no longer the preserve of mathematicians, statisticians, or cartographers. As technology leaders, we can gather metrics around...
Use R 4, RStudio, Tidyverse, and Shiny to interrogate and analyze your data, and then use the D3 JavaScript library to format and display that data in an elegant, informative, and interactive way. You will learn how to gather data effectively, and also how to understand the philosophy and implementation of each type of chart, so as to be able to represent the results visually.
With the popularity of the R language, the art and practice of creating data visualizations is no longer the preserve of mathematicians, statisticians, or cartographers. As technology leaders, we can gather metrics around what we do and use data visualizations to communicate that information. Pro Data Visualization Using R and JavaScript combines the power of the R language with the simplicity and familiarity of JavaScript to display clear and informative data visualizations.
Gathering and analyzing empirical data is the key to truly understanding anything. We can track operational metrics to quantify the health of our products in production. We can track quality metrics of our projects, and even use our data to identify bad code. Visualizing this data allows anyone to read our analysis and easily get a deep understanding of the story the data tells. This book makes the R language approachable, and promotes the idea of data gathering and analysis mostly using web interfaces.
What You Will Learn
Who This Book Is For
Programmers and data scientists/analysts who have some prior experience with R and JavaScript.
With the popularity of the R language, the art and practice of creating data visualizations is no longer the preserve of mathematicians, statisticians, or cartographers. As technology leaders, we can gather metrics around what we do and use data visualizations to communicate that information. Pro Data Visualization Using R and JavaScript combines the power of the R language with the simplicity and familiarity of JavaScript to display clear and informative data visualizations.
Gathering and analyzing empirical data is the key to truly understanding anything. We can track operational metrics to quantify the health of our products in production. We can track quality metrics of our projects, and even use our data to identify bad code. Visualizing this data allows anyone to read our analysis and easily get a deep understanding of the story the data tells. This book makes the R language approachable, and promotes the idea of data gathering and analysis mostly using web interfaces.
What You Will Learn
- Carry out data visualization using R and JavaScript
- Use RStudio for data visualization
- Harness Tidyverse data pipelines Apply D3 and R Notebooks towards your data
- Work with the R Plumber API generator, Shiny, and more
Who This Book Is For
Programmers and data scientists/analysts who have some prior experience with R and JavaScript.
Dieser Download kann aus rechtlichen Gründen nur mit Rechnungsadresse in A, B, BG, CY, CZ, D, DK, EW, E, FIN, F, GR, HR, H, IRL, I, LT, L, LR, M, NL, PL, P, R, S, SLO, SK ausgeliefert werden.
Alle Preise in Euro und inkl. der gesetzl. MwSt. | Innerhalb Deutschlands liefern wir preisgebundene Bücher versandkostenfrei. Weitere Informationen: bitte hier klicken
Support
Bitte wähle dein Anliegen aus:
Rechnungen
Bestellstatus
Retourenschein
Storno


