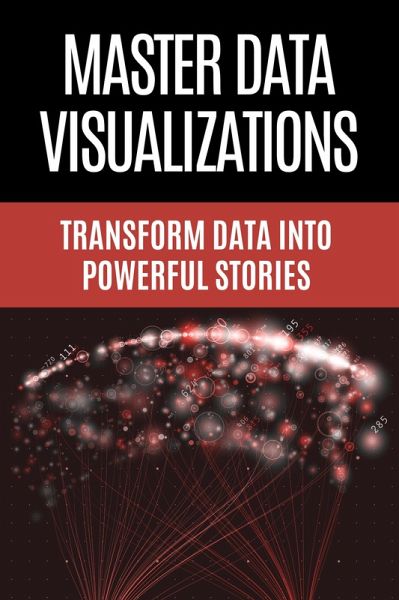
Master Data Visualizations - Transform Data into Powerful Stories (eBook, ePUB)

PAYBACK Punkte
0 °P sammeln!
Master Data Visualization: Transform Data into Powerful Stories is your essential guide to turning raw numbers into meaningful, beautiful visuals that captivate and inform.Whether you're a designer, business professional, analyst, or educator, this book walks you through the art and science of choosing the right chart for the right message. Across 11 structured chapters, you'll learn how to use bar charts, line graphs, scatter plots, heatmaps, treemaps, funnel charts, Sankey diagrams, and network maps to reveal insights, simplify complexity, and support smarter decisions.With over 50 visual ex...
Master Data Visualization: Transform Data into Powerful Stories is your essential guide to turning raw numbers into meaningful, beautiful visuals that captivate and inform.
Whether you're a designer, business professional, analyst, or educator, this book walks you through the art and science of choosing the right chart for the right message. Across 11 structured chapters, you'll learn how to use bar charts, line graphs, scatter plots, heatmaps, treemaps, funnel charts, Sankey diagrams, and network maps to reveal insights, simplify complexity, and support smarter decisions.
Whether you're a designer, business professional, analyst, or educator, this book walks you through the art and science of choosing the right chart for the right message. Across 11 structured chapters, you'll learn how to use bar charts, line graphs, scatter plots, heatmaps, treemaps, funnel charts, Sankey diagrams, and network maps to reveal insights, simplify complexity, and support smarter decisions.
- With over 50 visual examples included, this guide doesn't just tell you what worksit shows you.
- From visual thinking principles to real-world dashboard-ready examples, you'll gain the skills to:
- Communicate trends, relationships, comparisons, and outliers
- Use the right chart for every business, product, or research need
- Build stunning visuals that are functional, accessible, and impactful
- This is not just a chart catalogit's your blueprint for storytelling with data.
Dieser Download kann aus rechtlichen Gründen nur mit Rechnungsadresse in A, B, CY, CZ, D, DK, EW, E, FIN, F, GR, H, IRL, I, LT, L, LR, M, NL, PL, P, R, S, SLO, SK ausgeliefert werden.


