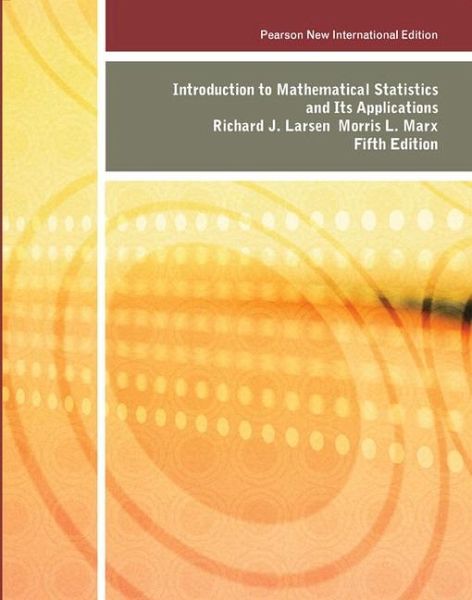
Introduction to Mathematical Statistics and Its Applications

PAYBACK Punkte
33 °P sammeln!
Noted for its integration of real-world data and case studies, this text offers sound coverage of the theoretical aspects of mathematical statistics. The authors demonstrate how and when to use statistical methods, while reinforcing the calculus that students have mastered in previous courses. Throughout theFifth Edition, the authors have added and updated examples and case studies, while also refining existing features that show a clear path from theory to practice.
Features + Benefits
Standard statistical techniques are presented in a mathematical context, enabling students to see the underlying hypotheses for the applications.
Superior treatment of real-world data uses case studies and practical, worked-out examples to motivate statistical reasoning and demonstrate the application of statistical methods to a wide variety of real-world situations.
Numerous and interesting homework exercises engage the student and illuminate the main points of the text.
The authors’ writing style presents concepts and applications in an engaging narrative.
Sound coverage of the theoretical aspects of mathematical statistics carefully explains the mathematics and development of the statistical theory.
Accessible mathematical prerequisites mediate between a techniques book and a graduate-level first course in mathematical statistics.
Integrated review of calculus reinforces students’ prior knowledge by reviewing calculus as necessary throughout the presentation.
1. Introduction
1.1 An Overview
1.2 Some Examples
1.3 A Brief History
1.4 A Chapter Summary
2. Probability
2.1 Introduction
2.2 Sample Spaces and the Algebra of Sets
2.3 The Probability Function
2.4 Conditional Probability
2.5 Independence
2.6 Combinatorics
2.7 Combinatorial Probability
2.8 Taking a Second Look at Statistics (Monte Carlo Techniques)
3. Random Variables
3.1 Introduction
3.2 Binomial and Hypergeometric Probabilities
3.3 Discrete Random Variables
3.4 Continuous Random Variables
3.5 Expected Values
3.6 The Variance
3.7 Joint Densities
3.8 Transforming and Combining Random Variables
3.9 Further Properties of the Mean and Variance
3.10 Order Statistics
3.11 Conditional Densities
3.12 Moment-Generating Functions
3.13 Taking a Second Look at Statistics (Interpreting Means)
Appendix 3.A.1 MINITAB Applications
4. Special Distributions
4.1 Introduction
4.2 The Poisson Distribution
4.3 The Normal Distribution
4.4 The Geometric Distribution
4.5 The Negative Binomial Distribution
4.6 The Gamma Distribution
4.7 Taking a Second Look at Statistics (Monte Carlo Simulations)
Appendix 4.A.1 MINITAB Applications
Appendix 4.A.2 A Proof of the Central Limit Theorem
5. Estimation
5.1 Introduction
5.2 Estimating Parameters: The Method of Maximum Likelihood and the Method of Moments
5.3 Interval Estimation
5.4 Properties of Estimators
5.5 Minimum-Variance Estimators: The Cramér-Rao Lower Bound
5.6 Sufficient Estimators
5.7 Consistency
5.8 Bayesian Estimation
5.9 Taking A Second Look at Statistics (Beyond Classical Estimation)
Appendix 5.A.1 MINITAB Applications
6. Hypothesis Testing
6.1 Introduction
6.2 The Decision Rule
6.3 Testing Binomial Data–H0: p = po
6.4 Type I and Type II Errors
6.5 A Notion of Optimality: The Generalized Likelihood Ratio
6.6 Taking a Second Look at Statistics (Statistical Significance versus “Practical” Significance)
7. Inferences Based on the Normal Distribution
7.1 Introduction
7.2 Comparing Y-µ s/ vn and Y-µ S/ vn
7.3 Deriving the Distribution of Y-µ S/ vn
7.4 Drawing Inferences About µ
7.5 Drawing Inferences About s2
7.6 Taking a Second Look at Statistics (Type II Error)
Appendix 7.A.1 MINITAB Applications
Appendix 7.A.2 Some Distribution Results for Y and S2
Appendix 7.A.3 A Proof that the One-Sample t Test is a GLRT
Appendix 7.A.4 A Proof of Theorem 7.5.2
8. Types of Data: A Brief Overview
8.1 Introduction
8.2 Classifying Data
8.3 Taking a Second Look at Statistics (Samples Are Not “Valid”!)
9. Two-Sample Inferences
9.1 Introduction
9.2 Testing H0: µX =µY
9.3 Testing H0: s2X=s2Y–The F Test
9.4 Binomial Data: Testing H0: pX = pY
9.5 Confidence Intervals for the Two-Sample Problem
9.6 Taking a Second Look at Statistics (Choosing Samples)
Appendix 9.A.1 A Derivation of the Two-Sample t Test (A Proof of Theorem 9.2.2)
Appendix 9.A.2 MINITAB Applications
10. Goodness-of-Fit Tests
10.1 Introduction
10.2 The Multinomial Distribution
10.3 Goodness-of-Fit Tests: All Parameters Known
10.4 Goodness-of-Fit Tests: Parameters Unknown
10.5 Contingency Tables
10.6 Taking a Second Look at Statistics (Outliers)
Appendix 10.A.1 MINITAB Applications
11. Regression
11.1 Introduction
11.2 The Method of Least Squares
11.3 The Linear Model
11.4 Covariance and Correlation
11.5 The Bivariate Normal Distribution
11.6 Taking a Second Look at Statistics (How Not to Interpret the Sample Correlation Coefficient)
Appendix 11.A.1 MINITAB Applications
Appendix 11.A.2 A Proof of Theorem 11.3.3
12. The Analysis of Variance
12.1 Introduction
12.2 The F Test
12.3 Multiple Comparisons: Tukey’s Method
12.4 Testing Subhypotheses with Contrasts
12.5 Data Transformations
12.6 Taking a Second Look at Statistics (Putting the Subject of Statistics together–the Contributions of Ronald A. Fisher)
Appendix 12.A.1 MINITAB Applications
Appendix 12.A.2 A Proof of Theorem 12.2.2
Appendix 12.A.3 The Distribution of SSTR/(k—1) SSE/(n—k)When H1 is True
Answers to Selected Odd-Numbered Questions
Index
Noted for its integration of real-world data and case studies, this text offers sound coverage of the theoretical aspects of mathematical statistics. The authors demonstrate how and when to use statistical methods, while reinforcing the calculus that students have mastered in previous courses. Throughout the Fifth Edition, the authors have added and updated examples and case studies, while also refining existing features that show a clear path from theory to practice.


