Franz Buscha
Graphs Everyone Should Know and How to Create Them in Stata
Franz Buscha
Graphs Everyone Should Know and How to Create Them in Stata
- Broschiertes Buch
- Merkliste
- Auf die Merkliste
- Bewerten Bewerten
- Teilen
- Produkt teilen
- Produkterinnerung
- Produkterinnerung
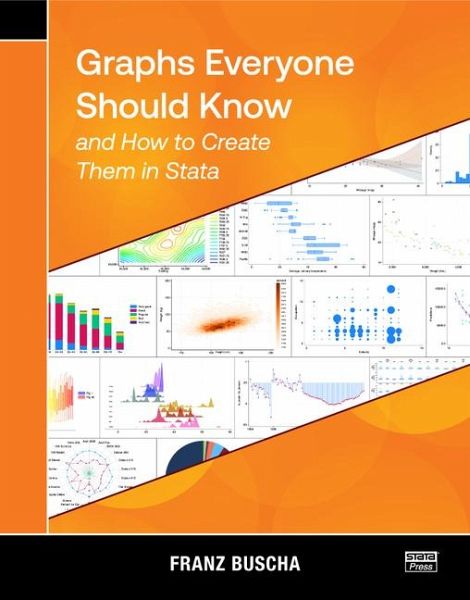
Franz Buscha's book, Graphs Everyone Should Know and How to Create Them in Stata, is for anyone who uses Stata to make graphs. Beginners will find a complete collection of tools for effectively visualizing their data and results. Experienced Stata users are certain to learn some new tricks as well.
Produktdetails
- Produktdetails
- Verlag: Stata Press
- Seitenzahl: 452
- Erscheinungstermin: 29. April 2025
- Englisch
- Abmessung: 234mm x 183mm x 29mm
- Gewicht: 974g
- ISBN-13: 9781597184137
- ISBN-10: 1597184136
- Artikelnr.: 73535554
- Herstellerkennzeichnung
- Libri GmbH
- Europaallee 1
- 36244 Bad Hersfeld
- gpsr@libri.de
- Verlag: Stata Press
- Seitenzahl: 452
- Erscheinungstermin: 29. April 2025
- Englisch
- Abmessung: 234mm x 183mm x 29mm
- Gewicht: 974g
- ISBN-13: 9781597184137
- ISBN-10: 1597184136
- Artikelnr.: 73535554
- Herstellerkennzeichnung
- Libri GmbH
- Europaallee 1
- 36244 Bad Hersfeld
- gpsr@libri.de
Franz Buscha is a Professor of Economics in the School of Organisations, Economy and Society at the University of Westminster (London, U.K.) with 20 years of Stata and econometric experience. Franz's research specializes in areas of labour economics, including the returns to education and social mobility. He has published in leading journals, contributed to numerous policy reports, and held prestigious grants. He has even had a radio show called Policy Matters for a few years! Franz loves all things Stata and hopes that he will someday be able to learn everything about it.
I Graphs for univariate data Histograms Introduction A basic histogram
Spike plots Histograms with varying bin widths Multiple histograms Mirrored
histograms Ridgeline histograms Kernel density plots Introduction A basic
kernel density plot Cumulative distribution plots Multiple kernel density
plots Mirrored kernel density plots Ridgeline kernel density plots Box
plots Introduction A basic box plot Horizontal box plots Box plots with
histograms Multiple box plots Violin plots Introduction A basic violin plot
Horizontal violin plots Multiple violin plots Custom widths Dot plots
Introduction A basic dot plot Multiple dot plots Horizontal dot plots Beam
plots Dot plots with box plots Cumulative dot plots Stem-and-leaf plots
Introduction A basic stem-and-leaf plot A graphical stem-and-leaf plot A
horizontal stem-and-leaf plot Mirrored stem-and-leaf plots Distributional
diagnostic plots Introduction Symmetry plots Skew plots Quantile-uniform
plots Quantile-normal plots Quantile ¿ plots Quantile-quantile plots
Rootograms Introduction A basic rootogram Hanging rootograms Univariate bar
charts Introduction A basic frequency bar chart Percentage bar charts
Horizontal bar charts Sorted bar charts Multiple bar charts Dot charts Pie
charts Introduction A basic pie chart Multiple pie charts Radar charts
Introduction A basic radar chart Multiple-radar charts Radar charts with
too few or too many categories Frequency radar chart II Graphs for
bivariate data Scatterplots Introduction A basic scatterplot Scatterplots
with multiple y and x variables Scatterplots over categorical groups
Scatterplots with marginal distributions Binned scatterplots Heat plots
Introduction A basic heat plot Hex-heat plots Sunflower plots Line plots
Introduction A basic area plot Sparkline plots Area and shaded range plots
Introduction A basic area plot Data with variation Shaded range plots Pair
plots Multiple area and shaded range plots Lines of best fit Introduction A
basic best fit plot Quadratic fits Fractional polynomial fits Multiple
lines of best fit Custom polynomial fits Multiple custom polynomial fits
Constrained lines of best fit Nonparametric fits (smoothers) Lines of best
fit with confidence intervals Multiple lines of best fit with confidence
intervals Lines of best fit with recast confidence intervals Jitter plots
Introduction A basic jitter plot A complex jitter plot Jitter plots with
continuous values Table plots Introduction A basic table plot Three-way
table plot Balloon plots Bivariate bar charts Introduction A basic two-way
frequency bar chart Stacked bar charts Introduction A basic two-way stacked
frequency bar chart Two-way stacked percentage bar chart Slide plots Mosaic
plots III Graphs for multivariate data Matrix plots Introduction
Correlation matrix Matrix scatterplots Cross plots Trellis plots Contour
plots Introduction A basic contour plot Contour-line plots Contour plots
with custom colors Contour plots with small and incomplete datasets
Trivariate heat plots Introduction A basic trivariate heat plot Bubble
plots Introduction A basic bubble plot Chernoff faces Introduction Basic
Chernoff faces Triplots Introduction A basic triplot 3D scatterplot
Introduction A basic 3D scatterplot 3D scatterplot without autoscaling 3D
surface plots IV Special graphs Animated graphs Introduction A basic
animated graph Rainbow plots Introduction A basic rainbow plot A complex
rainbow line plot A complex rainbow box plot Plotting regression results
Introduction Visualizing coefficients from one regression Plotting
coefficients from two regressions Plotting coefficients from four
regressions Plotting coefficients from a regression with an interaction
term Maps Introduction A basic geographic map Choropleth maps Submaps
Plotting equations Introduction A basic mathematical function A custom
equation A statistical function Polynomial regression terms References
Author index Subject index