28,99 €
28,99 €
inkl. MwSt.
Sofort per Download lieferbar
payback
0 °P sammeln
28,99 €
28,99 €
inkl. MwSt.
Sofort per Download lieferbar

Alle Infos zum eBook verschenken
payback
0 °P sammeln
Als Download kaufen
28,99 €
inkl. MwSt.
Sofort per Download lieferbar
payback
0 °P sammeln
Jetzt verschenken
28,99 €
inkl. MwSt.
Sofort per Download lieferbar

Alle Infos zum eBook verschenken
payback
0 °P sammeln
  • Format: ePub

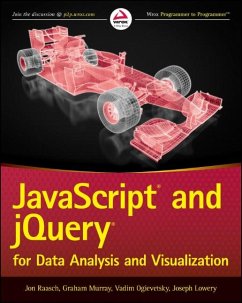
Go beyond design concepts--build dynamic data visualizations using JavaScript JavaScript and jQuery for Data Analysis and Visualization goes beyond design concepts to show readers how to build dynamic, best-of-breed visualizations using JavaScript--the most popular language for web programming. The authors show data analysts, developers, and web designers how they can put the power and flexibility of modern JavaScript libraries to work to analyze data and then present it using best-of-breed visualizations. They also demonstrate the use of each technique with real-world use cases, showing how…mehr

  • Geräte: eReader
  • mit Kopierschutz
  • eBook Hilfe
  • Größe: 17.32MB
Produktbeschreibung
Go beyond design concepts--build dynamic data visualizations using JavaScript JavaScript and jQuery for Data Analysis and Visualization goes beyond design concepts to show readers how to build dynamic, best-of-breed visualizations using JavaScript--the most popular language for web programming. The authors show data analysts, developers, and web designers how they can put the power and flexibility of modern JavaScript libraries to work to analyze data and then present it using best-of-breed visualizations. They also demonstrate the use of each technique with real-world use cases, showing how to apply the appropriate JavaScript and jQuery libraries to achieve the desired visualization. All of the key techniques and tools are explained in this full-color, step-by-step guide. The companion website includes all sample codes used to generate the visualizations in the book, data sets, and links to the libraries and other resources covered. * Go beyond basic design concepts and get a firm grasp of visualization approaches and techniques using JavaScript and jQuery * Discover detailed, step-by-step directions for building specific types of data visualizations in this full-color guide * Learn more about the core JavaScript and jQuery libraries that enable analysis and visualization * Find compelling stories in complex data, and create amazing visualizations cost-effectively Let JavaScript and jQuery for Data Analysis and Visualization be the resource that guides you through the myriad strategies and solutions for combining analysis and visualization with stunning results.

Dieser Download kann aus rechtlichen Gründen nur mit Rechnungsadresse in A, B, BG, CY, CZ, D, DK, EW, E, FIN, F, GR, HR, H, IRL, I, LT, L, LR, M, NL, PL, P, R, S, SLO, SK ausgeliefert werden.

Autorenporträt
Jon Raasch is a freelance web developer and author of several books. A user-experience junkie, he builds HTML5 and JavaScript apps for desktop and mobile devices. Graham Murray is a software architect specializing in building UI development tools. Vadim Ogievetsky is a data flow processor at Metamarkets, where he works with data visualization framework development. Joseph Lowery is a professional web designer and online trainer with courses on website and app creation as well as data visualization at Lynda.com. Wrox guides are crafted to make learning programming languages and technologies easier than you think. Written by programmers for programmers, they provide a structured, tutorial format that will guide you through all the techniques involved.